|
The foundation work (referred to as "Original Project" below) of the presenting project was first carried out by the "Human Cognition Program" of the Research Institute for the Humanities, between 1992 and 1998 under the leadership of Professor Ho Hsiu-hwang. In 1998, a series of research reports (altogether 14 in number), including some statistical tables and various trans-regional and diachronic comparison charts, were compiled for private circulation. As far as I know, only three sets of these reports were printed, one of which was sent to the Chinese University library for retention. Later on, the Human Cognition Program was closed due to funding shartage, as a result of which the Chinese Character Frequency Report was not further publicized.
In early 2001 when Professor Ho's retirement was drawing near, members of the "Humanities Computing and Methodology Programme" proposed to Professor Ho the plan of reprocessing and repackaging of the findings of the original project with up-to-date information technology so that these valuable findings can be made known to a wider public through the World Wide Web. This proposal gained the permission and full support of Professor Ho, to whom we would like to extend our gratitude on behalf of all potential users.
Frequency surveys of Chinese characters have been carried out in Mainland China and Taiwan many times, contributing to foundation education in the respective regions. In Hong Kong, however, this kind of research has never been undertaken to any reasonably large scale (excluding vocabulary frequency). The present project stands out as an epoch-making one in this area. Furthermore, in terms of research methodology, the original project introduced the comparative concepts of "trans-regionality" and "diachronism", which are extremely innovative and useful in Character Frequency Research. The reason the "Humanities Computing and Methodology Programme" took over the project is largly due to the enormous developmental potential of these innovative notions. Therefore, in the process of reprocessing and repackaging old materials, the most challenging task fof the current project team is to exhaust all possible computational means to bring the "trans-regional" and "diachronic" nature of the original project to full expression.

Particulars of the Chinese Character Frequency Database:
- Composition of the Corpus:
The collection of Modern Chinese Corpus materials in our web page can be grouped by the time period and region from which they are derived. The Corpus covers three regions, namely Hong Kong, Mainland China and Taiwan, each taken from two periods, the 60s (1960-1969) on the one hand and the 80s to 90s (1980-1993) on the other. This gives altogether six (3*2) Corpus Units. Texts in each Unit can be categorized into three literary forms: lyric, narrative, and commentary. The texts are then grouped into hundreds of files of different lengths. Each Corpus Unit consists of approximately 660,000 characters, making a total of 3,970,514 characters for the whole corpus. Further information can be found at "Corpus Overview".
- Categories of Statistical Tables:
Statistical tables on modern Chinese Characters Frequency are divided into three categories. Users may access the data by making appropriate selection in the left frame with the mouse pointer. The three categories are:
- Basic Character Frequency Statistical Tables: This type of table states clearly the frequency data of all Chinese Characters within a Corpus Unit. Information listed includes individual characters, rankings, radicals, number of strokes, frequency count, frequency, accumulative frequency count, accumulative frequency, file entry count, and file entrance rate. The list of individual characters, rankings and frequency counts were included in the Original Project, the web project team introduces others. Users may select desired regions and periods by clicking on related menus in the left frame.
- Trans-Regional Comparison Tables: This type of table compares the characters' usage frequency in all three regions within the same period. Users must first choose a desired period, and then select a region as the Reference Region, before calling for the table. This type of table gives information on characters in use, rankings, frequency count and frequency of the reference region. The regions compared, in addition to the above, it presents data on Trans-Regional Character Frequency Disparity in relation to the Reference Region (see below for details). The period and Reference Region can be selected from the menu in the left frame.
- Diachronic Comparison Tables: This type of table compares Characters' Usage Frequency of a region in two periods. Users must first select a desired region before calling for the table. Characters in use in both periods of the selected region are listed in the middle column, with Character Frequency data of the 60s arranged on the left and that of the 80s to 90s on the right of the characters for easy comparison. The table provides different types of data related to Character Frequency, as well as Retrogressive Frequency Disparity (left) and Progressive Frequency Disparity (right). (See next section for details)
- Sorting of the Tables:
In the statistical report of the Original Project, the sorting of the characters in the three types of tables listed above is based on the Frequency Count of each character. In the original project, characters with the same Frequency are sorted by their order of appearance in common dictionaries. In our web page, the principles of sorting need to be modified due to reprocessing of the materials by computation. Now characters with the same Frequency Count will be sorted by the order of their radicals in the "Kang Xi Dictionary"; if the radicals are the same, then by their number of strokes; and if the number of strokes is also the same, then by the Big5-encodings of the respective characters.
Besides sorting that are based mainly on Frequency Count, our web page introduces a few other ways of sorting to supplement and strengthen the contents of the three types of tables mentioned above. These new sorting schemes are listed below:
- File Entrance Rate: "Frequency" is calculated by dividing the Frequency Count of a character in a Corpus Unit by the total number of characters in that Unit, times a hundred percent. "File Entrance Rate" is a character's "File Entry Count" (i.e. number of files in a Corpus Unit that contains the character) divided by the total number of files in that Corpus Unit, times a hundred percent. File Entrance Rate is for the most part proportionate to Frequency. However, they are constructed with different methods, and therefore have different meanings. In the Corpus Unit "Hong Kong 60s", for example, both characters "溴" and "憾" have Frequency Count of "30", thus a common Frequency of 0.004531%. However, the File Entry Count of "溴" is "1" while that of "憾" is as high as "29". Therefore, the File Entrance Rate of "憾" (6.07%) is far above that of "溴" (0.21%). Taking File Entrance Rate into consideration, we can justifiably say that "憾" is much needed to be learned than "溴". Therefore, besides providing the standard format of sorting Character Frequency data, our web page also supports sorting of the "Basic Character Frequency Statistical Table" based on "File Entrance Rate".
- Trans-Regional Frequency Disparity: "Frequency Disparity" is another important concept of application introduced by our web project team. Frequency Disparity refers to the rate of difference between Frequencies. It shows the percentage increase or decrease between two values of Frequency compared. The purpose of computing Frequency Disparity is to express fully the notions of "trans-Regionality" and "diachronism" as depicted above. To compute Trans-Regional Frequency Disparity, one must set a region as the area of reference (referred to as "Reference Region" in earlier sections), then compare the data of the other two regions with it. If we set (R) as the Frequency of a character in the reference Region, and (C) as the Frequency of the character in the regions compared, then the Trans-Regional Frequency Disparity would be: ((C-R)/R)*100%. Since there are various ways of assembling the Reference Region and regions compared, our web page named each individual type of Trans-Regional Frequency Disparity by placing the name of the Reference Region in the front followed by that of the compared region. This makes up six types of Trans-Regional Frequency Disparity, namely HK-Mainland, HK-Taiwan, Mainland-HK, Mainland-Taiwan, Taiwan-HK and Taiwan-Mainland. All computation is based on the formula stated above. Besides sorting based on the Reference Region's character rankings (equivalent to Frequency Count), our web page also allows sorting by Frequency Disparities.
- Diachronic Frequency Disparity: Applying the concept of frequency disparity to usage frequency of two periods in a region gives Diachronic Frequency Disparity. If we set an earlier period as the standard of reference for computation and observe changes in later periods chronologically, the value obtained can be named as "Progressive Frequency Disparity". If we set the later period as the standard of reference and observe changes backward through time, the value computed can be named as "Retrogressive Frequency Disparity". All computation can also be based on the formula ((C-R)/R)*100% disregarding sequences of time periods (R and C here represent Frequency in the Reference Period and Frequency of the period compared). Similarly, other than sorting by rankings of the Standard Period, users can chose to have "Progressive Frequency Disparity" or "Retrogressive Frequency Disparity" as criteria of sorting.
- Numerical Tabulation of Statistical data of Individual Characters:
The Corpus Database of our web page (a total of six units) contains 6507 characters. To have an overall view of each individual character, users may access that character's individual page through various channels:
- Each character on the statistical tables links automatically to the respective Individual Character Page.
- Enter a character into the yellow square at the top frame of the web page. Click "Search" to access the Specialized Character Page. If the character were not included in the six Units of our Corpus Database, related links would be provided for users' convenience.
- Users may call up the "Radical Table" by selecting the link "Search by Radicals" inside the yellow square at the top frame. The radicals in the table are arranged according to their order of arrangements in the "Kang Xi Dictionary". Users may reach individual characters of different radicals through this path.
- Besides the three methods mentioned above, users may access Individual Character Page of User-defined Characters through the "User-defined Characters Table". The table lists characters that are included in Corpus but are not covered by the Big-5 encoding table.
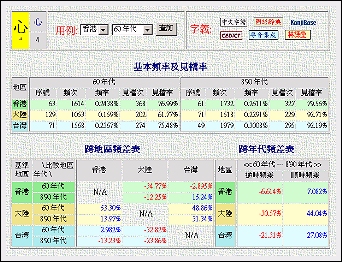 An Individual Character Page provides information on a character's shape, radical, number of strokes, and links to web information about the character's meanings and pronunciation provided by our research institute or other overseas institutions. To show a character's major statistical data and various values of Frequency Disparity, we arranged the character's "File Entrance Rate", "Trans-Regional Frequency Disparity" and "Diachronic Frequency Disparity" in three tables (see image on the right). In addition, graphs constructed automatically using these data are posted on the right of the tables (see next section for details). All instances of usage of the character in the Corpus Database can also be retrieved (see the section after next section for details).
- Graphical Representation of Statistical data of Individual Characters:
In pursuit of a straightforward and explicit understanding of characters' frequency details, statistical data are also represented through graphs. When users call for an Individual Character Page, related statistical graphs will appear automatically on the right. We have two types of graphs for the time being, which are "Frequency Count Graph" and "File Entrance Rate Graph". The design of these graphs is to display all related information from the Corpus Database in the form of visual images. This enables users to grasp complicated statistical relations such as "trans-Regionality" and "diachronism" with one glance.
- Frequency Count Graph: Each Corpus Unit consists of about 660,000 characters. We therefore use Frequency Count as reference for the graphs. The values of Frequency Count ranged between "0" and "30,617". To handle such wide range of values within limited space, logarithm of the values has to be taken.
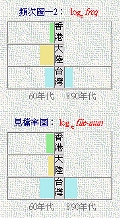
 We implement both log10 and loge in computation to suit values of different ranges. Frequency Count Graphs can be "read" in the following manner: Horizontal viewing allows comparison of Diachronic Frequency Disparity for each region (Progressive and Retrogressive Frequency Disparity). Vertical viewing conveys Regional Frequency Count in a way that allows the user to grasp easily and flexibly the Frequency Disparity between any two, or even three regions. For example, Frequency Count Graphs of characters such as
皆、焉、其、
乎、之、矣、
莫、也、云、
未、及、遂、
若、則、乃、
亦、兮、彼、
此、非、孰 and
倘 (being function characters [虛詞] in Classical Chinese) all reveal a "工" shape (see image on the right: "矣" as an example). This shows that Mainland China uses less of these characters than do Hong Kong and Taiwan. Besides, the fact that the "waistline" of these "工-shaped" graphs is usually thicker to the right shows that Mainland China is using more of these characters recently than they did in the 60s. Users are welcomed to judge in their own terms whether such changes involve political, social and cultural representations. We implement both log10 and loge in computation to suit values of different ranges. Frequency Count Graphs can be "read" in the following manner: Horizontal viewing allows comparison of Diachronic Frequency Disparity for each region (Progressive and Retrogressive Frequency Disparity). Vertical viewing conveys Regional Frequency Count in a way that allows the user to grasp easily and flexibly the Frequency Disparity between any two, or even three regions. For example, Frequency Count Graphs of characters such as
皆、焉、其、
乎、之、矣、
莫、也、云、
未、及、遂、
若、則、乃、
亦、兮、彼、
此、非、孰 and
倘 (being function characters [虛詞] in Classical Chinese) all reveal a "工" shape (see image on the right: "矣" as an example). This shows that Mainland China uses less of these characters than do Hong Kong and Taiwan. Besides, the fact that the "waistline" of these "工-shaped" graphs is usually thicker to the right shows that Mainland China is using more of these characters recently than they did in the 60s. Users are welcomed to judge in their own terms whether such changes involve political, social and cultural representations.
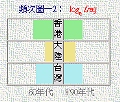
 File Entrance Rate Graph: Shapes of "File Entrance Rate Graph" and "Frequency Count Graph" of most characters are morphologically very similar. However, as mentioned earlier, although the File Entrance Rates of most characters are proportionate to the respective Frequency Counts, they are constructed using different methods of calculation, they therefore might in some cases appear so different from the latter that users would notice their difference immediately. Some examples for such odd cases are
舜、鑫、舅、
磯、砦、韶 (See image on the right: "韶" as an example, the upper graph is "韶" 's Frequency Count Graph, the lower one "韶" 's File Entrance Rate Graph"). The major reason for such differences is the intensive use of a character in a relatively some number of texts. In such cases, the validity of Frequency Statistics of the character involved must be taken with reservation. Other functions of "File Entrance Rate Graph" are subject to users' perception and discovery. File Entrance Rate Graph: Shapes of "File Entrance Rate Graph" and "Frequency Count Graph" of most characters are morphologically very similar. However, as mentioned earlier, although the File Entrance Rates of most characters are proportionate to the respective Frequency Counts, they are constructed using different methods of calculation, they therefore might in some cases appear so different from the latter that users would notice their difference immediately. Some examples for such odd cases are
舜、鑫、舅、
磯、砦、韶 (See image on the right: "韶" as an example, the upper graph is "韶" 's Frequency Count Graph, the lower one "韶" 's File Entrance Rate Graph"). The major reason for such differences is the intensive use of a character in a relatively some number of texts. In such cases, the validity of Frequency Statistics of the character involved must be taken with reservation. Other functions of "File Entrance Rate Graph" are subject to users' perception and discovery.
As indicated by contemporary brain science, human beings process mathematical information with the left-brain, and images with the right. Although mathematical representations are more accurate, they are not as conspicuous and conveyable as images. Through effective use of the graphs, users may discover internal relationships that might not be easily noticeable through statistical tables.
- Displaying Examples of Usage:
Upon entrance into an Individual Character Page, users may view all instances of that character's usage in each Corpus Unit by selecting "Usage" from the related menu. After clicking "Look up", the usage examples would appear on the right. Each example consists of nine characters, with four on the right and four on the left of the captioned character (aligned at the center) to show the context (see image on the right). Since all punctuation marks have already been deleted in the Original Project, we have no punctuation marks in the examples. When users finished viewing examples in a Corpus Unit, they may switch to view examples in other Corpus Units by selecting from the options menu. To return to the graphs, click on the yellow dot under the character in the yellow square.
- Encoding and User font:
The multiplicity of Chinese encoding is widely known. Therefore, the "trans-regional" nature of our project makes the comparison of different regional codes a significant problem. The Original Project drew up a series of tactics to solve the problem. The following quotations from the "Introduction" of the report of the Original Project will explain how things work:
- "Font and shapes of the characters are problems that require attention. Our basic principle is to use traditional fonts as the standard. Therefore, we enter data from Mainland China in traditional fonts. However, as some of these texts involved the thematic discussion of 'simplified characters', therefore some simplified characters have to remain untranscribed in the Character Frequency Statistics of the Mainland. Since both Hong Kong and Taiwan use traditional fonts, we enter the data exactly as shown. However, the introduction of simplified characters does have certain impact on Hong Kong and Taiwan's written languages. Therefore, simplified characters are also present in Character Frequency Statistics of Hong Kong and Taiwan."
- "The problem of font shapes is more complicated. Our principle is to comply with the fonts as they appeared in the original documents. This involves intricate relationships between orthographs, allographs, conventional graphs, etc., which requires further explanations. Since all information details have to be input into the computer for further processing, the repertoire of available character fonts in the word-processing software is a major constraint we have to face. No matter whether the character is orthographs, allographs or conventional graphs, as long as the character exists in the character-font database, we enter it exactly as shown in the original documents. If the character database does not contain the orthographs, we enter its allographs or instead. User-defined font is the last resort. If the character is a allographs that does not exist in the database, we enter its orthographs or allographs instead. User-defined character is again the last resort. If the character is a conventional graphs that is not within the character database, we enter its orthographs or allographs instead. Besides the two circumstances mentioned above, the usage frequency of that character shape is also a determining factor in our decision to use user-defined characters. No matter whether the character is orthographs, allographs or conventional graphs, as long as it is frequently used, we would create a user font for it. Some examples are
 , ,  , ,  , ,  and and  . The last problem involving font shapes concerns numbers. Since we only enter Chinese characters, all Arabic numerals and "○" are deleted." . The last problem involving font shapes concerns numbers. Since we only enter Chinese characters, all Arabic numerals and "○" are deleted."
As for user-defined fonts, one thing is noteworthy: To avoid further confusion in Chinese encoding, we adopt the tactics of the "Humanities Computing and Methodology Programme", i.e., we in principle do not support the assignment of internal codes to user fonts. User fonts are displayed as images instead. Users may access our web page's index of 103 user fonts by selecting the "User fonts" link.
- Other Technical Particulars
- Hardware: Our web page is implemented on an HP-9000 D-390 server. The operating system is HP-UX Release 11.00.
- Software: Mainly Perl, PHP, MySQL and JavaScript.
- Resolution: Our web page has a rather complicated structure, with many types of table and graph involved. To ensure an ideal screen display, we suggest a screen resolution of 1024*768. If screen resolution can only be set at 800*600, then font size must be stepped down to "small" to guarantee good visual effect.
- Color: Our web page's Character Frequency data cover three regions. For user's convenience, we systematically use green for Hong Kong, light yellow for Mainland China, and sky blue for Taiwan. Frequency Disparities with positive values are printed in blue, while negative values are in red.
- Mathematical Computation: As the calculated values of frequencies of characters could vary significantly, instead of representing them with fixed decimals, we have chosen to express them with four significant figures. Although the values of Frequency Disparities vary to a much lesser degree, we still use four significant figures so as to achieve more accurate comparisons. As for File Entrance Rate, which is simple in computation and does not require accurate comparison, only two significant figures are used. When encountering the "Divide by zero" problem in calculating Trans-Regional Frequency Disparity, Perl Scripts are used to bypass the impasse in computation. Frequency Count of characters in our Corpus Database ranges from "0", "1", to a few ten thousands. There are a large number of characters having a frequency count of "1". Since both log101 and loge1 gives "0", a very narrow strip of color tag is generated deliberately to represent log101 and loge1. This amounts to visibility of the counts of 1, so that frequency 1 could be differentiated from frequency 0. By similar logic, we expand File Entrance Rates by multiplication by a certain factor before taking logarithms. This is because File Entrance Rates can be as low as 0.21, 0.24, 0.28, 0.31, 0.40, etc. If not expanded, their logarithms would be negative and they would not be plottable as graphs.
- Standard Deviation: The standard deviation, usually abbreviated with the Greek symbol s, or as SD, is the most common measure of the centrality and dispersion of the sample data. It is defined to be s=
 (Xi=frequency of each individual data, "X-bar"= Arithematic mean = Sum of data points / No. of data points). A large SD indicates that the data items are spread out in magnitude, varying greatly from the mean, having more dispersion. When analysing the 6 Corpus Units, the SD tells us how diverse the character frequencies are. A bigger SD in a Corpus Unit tells us that there are relatively more characters having frequencies toward one extreme or the other in that unit, and vice versa. The table can be found in "Corpus Overview" . More information about Standard Deviation can be found here in English or Chinese . (Xi=frequency of each individual data, "X-bar"= Arithematic mean = Sum of data points / No. of data points). A large SD indicates that the data items are spread out in magnitude, varying greatly from the mean, having more dispersion. When analysing the 6 Corpus Units, the SD tells us how diverse the character frequencies are. A bigger SD in a Corpus Unit tells us that there are relatively more characters having frequencies toward one extreme or the other in that unit, and vice versa. The table can be found in "Corpus Overview" . More information about Standard Deviation can be found here in English or Chinese .
Lastly, we would like to point out that from the perspective of Educational planning, Character Frequency Statistics and Character Frequency Research are essential structural foundations. Just as the establishment of infrastructure might contribute to the development of an economy, so is the research in Character Frequency Statistics of great importance for culture and education. For a country's economy, the well establishment of an infrastructure should be followed by further economic activities that utilize the former. Otherwise, the infrastructure would be worthless. Similarly, we must learn to utilize and integrate Character Frequency Statistics into educational, linguistic, cultural, social, political, economic and philosophical research in order to harvest its worth. In the process of constructing our web page, a number of educators expressed their high expectations on our project. Their high expectations are to us a form of encouragement as well as pressure. We felt so relieved on this day when we completed this web page, for all users might from this day on share the rest of the work with us.
The construction of this web page involved mainly technical work. In the process of reprocessing and repackaging the materials, we were able to benefit from the more recent advancements in computational means, which yield higher accuracy and efficiency. This reprocessing work leads to the discovery of a few minor bugs in the Original Project (such as user fonts). But it is precisely this reprocessing work that allows us to realize how much effort Professor Ho and his team have put into their work. The Original Project excelled in its choice of research tactics and in the actual parsing and analysis of the corpus texts, efforts that can never be replaced by machine intelligence. Therefore, before concluding this web page, I once again would like to convey my respect and gratitude to all members of the Original Project.
|
 Users' Guide
 回到主頁
回到主頁